In this article, Sean Smyth – Print Consultant with Smithers Pira examines the results of a new report that looks at the growth of Digital Print for Packaging to 2022. This report breaks down the projected growth by packaging application, and shows some surprising results.
In 2016 Smithers Pira published the latest version of what has proved to be a well-received report: “The Future of Digital Print for Packaging to 2022”. It looks at the trends, drivers, applications and new technology that is shaping the future production landscape of packaging and labels, with forecasts of the market development over the next five years. These years will see major changes as digital production goes mainstream that will make many brands and retailers look at packaging in new ways, making converters do different things as new supply chains develop.
In 2017 digitally printed labels and packaging add up to an overall $13.2 billion market globally. The label sector was the early adopter and is pretty mature in most regions. There is very strong growth in corrugated as very high performance single pass presses capable of tens of millions of square meters of output annually are snapped up by converters, cartons, flexible packaging and direct-to-shape, with developments in metal printing. In 2022 the sector will grow to be worth $23.2 billion after five healthy years of growth averaging 11.2% in value terms. Tonnage grows at an average CAGR of 28.1%, as cartons and the corrugated packaging comes on stream. So, no wonder you are reading the article – hopefully considering how your organization can take advantage of this growth. You are not alone.
The $13.2 billion is big, but digital packaging is only 3.33% of printed packaging and perhaps a little over 2.0% of all packaging (as there is so much non-printed). In terms of printed area the equivalent of 163 billion A4 prints is just 1.72% of the total, while the 1.7 million tons of products represents just under 1.03% of all packaging. By 2022 the $23.2 billion digital packaging sector will account for nearly 5.3% of packaging by value, the 334 billion A4 prints will be some 3.2% of the print area output while almost six million tons is also 3.2% of the total. So even after five years of very strong growth digital will still be a tiny minority – hardly the major disruption predicted by some. But it is a significant base that will set the stage for major changes in supply chains, and even the functions of packaging which are developing.
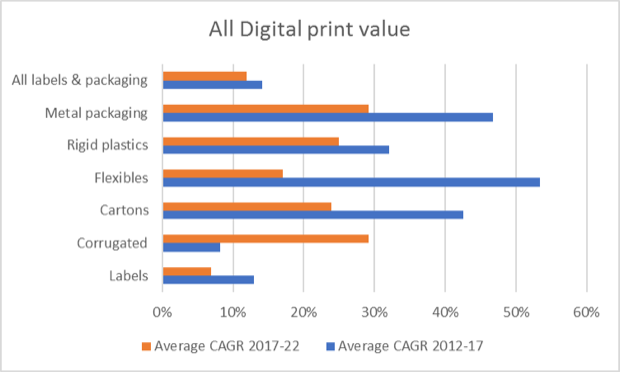
Growth is forecast in different applications and different regions at varying rates as shown in the figure, led by the small flexible packaging, metal and rigid plastics while corrugated, cartons and labels are the drivers of real volume growth.
Five-year growth rates in the value of digital packaging sectors from 2012 to 2022. Source: Smithers Pira
As more converters get involved and make investments they will find out how the technologies can be used to benefit their customers. There will be new campaigns and these will be copied, and converters will provide new services and response to their customers which will allow significant supply chain efficiencies, some of which are not clear in early 2017, but will open up over the next years to better suit the final packaging consumers. Satisfying buyers is the goal for all parties.
The digital packaging sector is maturing. Around 2010 the big question for brands and converters was: “What can the technology do?”, and what should it do. After seven years of concentrated development the question has changed to: “Where is the application value?” as all parties across the supply chains realize that using digital printing can help make them money. This is the case for brands/retailers (and their agencies including design), as well as for packaging and label converters, some of whom are really prospering. It is also true for the equipment/consumable suppliers as well, although not all have succeeded.
Drupa 2016 saw a real step-change in the quality and performance of digital printing, from established suppliers and newcomers into the digital arena who are experienced in packaging. HP is the market leader with thousands of Indigo presses producing very high-quality labels, cartons and flexible packaging while its inkjet monster presses are making inroads into corrugated. But HP is by no means alone as others push their quality, productivity and improve their cost of production position. There are important breakthroughs in new substrates and surface treatments, in finishing where digital methods are also making progress, and most importantly in workflow improvements.
R.R. Donnelley & Sons Company announced that the unsolicited non-binding and conditional “Alternative Acquisition Proposal” from a strategic party (the “Strategic Party”) to acquire all of the outstanding shares of RRD’s common stock for $11.50 per share in cash has been withdrawn. The Strategic Party did not provide specific reasons for its withdrawal. The Company remains subject to the Chatham Merger Agreement, pursuant to which Chatham will acquire all of the RRD common stock not already owned by affiliates of Chatham for $10.85 per share in cash.
Q3 Key messages *GAAP net sales, including the impact of foreign exchange, increased 6.4%; Non-GAAP organic net sales increased 5.5%; largely driven by strengthening demand for many of the Company’s products and services *GAAP and Non-GAAP income from operations exceeded prior year; both benefitted from higher sales and strong cost management despite supply chain challenges and inflation *GAAP operating margin improved 450 bps while Non-GAAP improved by 20 bps *GAAP earnings per share from continuing operations of $0.38 and Non-GAAP adjusted earnings per share from continuing operations of $0.57, both improved significantly from prior year *Cash used in operating activities during the nine months ended September 30, 2021 was $29 million compared to cash provided by operating activities of $25 million in the prior year period; current year results reflect working capital investments due to increased volume and inflation in addition to $33 million paid earlier this year to settle LSC bankruptcy-related claims and terminate certain interest rate swap agreements *Gross leverage ratio of 3.7x improved 1.0x from September 30, 2020; net leverage ratio of 3.2x improved 0.5x from the same period last year
*$34 million of operating cash flow from continuing operations, down $242 million year-over-year, and $15 million of free cash flow, down $245 million year-over-year *$1.47 billion of revenue, a decrease of 35.3 percent year-over-year or 34.6 percent in constant currency *GAAP earnings per share (EPS) from continuing operations of $0.11 per share, down $0.49 year-over-year, and adjusted EPS of $0.15, down $0.64 year-over-year